- Value of honey bee pollination in Michigan, based on 2015 data
The Western honey bee Apis mellifera plays a crucial role for US agriculture because it provides pollination for a large number of crops. The value of agricultural crops dependent on honey bee pollination was estimated to be $14.6 billion per year in the U.S. (Morse and Calderone, 2000). Last time (2010) I did some adding up and I estimated the value of honey bees to Michigan crops was about $980 million per year. I thought I needed to redo it again. So I used the most recent production data (2015 data) to do the calculations. What did I find out? Michigan’s fruit and vegetable industry produces over two billion dollars per year and nearly 50% of that value is due entirely to honey bee pollination (Table 1). This is more than 70 times the value of honey itself, which was $14.3 million in 2014 and $12.7 million in 2015.
How do you read the table? Column one are the crops by their name. Column 2 are the honey bee dependent factor. So if a crop produces nothing without honey bees, then it is 100% dependent on honey bees, and it would be entered as 1 in the table. Other crops only increase their yield slightly. For soybean, it is only a 10% increase after honey bee pollination, so it is 10% in the table. Column are are the total production in thousand of dollars, and column 4 are the adjusted values, the total values of production factored with the honey bee dependence factor (column 2). The last column are the values of production due to the pollination of honey bees. This undoubtedly is an underestimate since many crops are too small to be included in the official statistics.
Take home message: honey bees are worth over 1 billion dollars per year in Michigan!
Table 1. About 50% of the Michigan fruit and vegetable industry depend on honey bees (2015 data). Some crops do not need honey bees for production (e.g. cabbage, carrots, celery, and onions), but the production of their seeds are dependent on honey bees. While honey bees are important, native bees (non-Apis) will complement honey bees and play important roles also in pollination.
| Crop | % Depending on bees | Value ($1,000) | Adjusted Value ($1,000)% |
| Apple | 90 | 443,260 | 398,934 |
| Asparagus | 90 | 19,754 | 17,779 |
| Blueberry | 100 | 191,130 | 191,130 |
| Cabbage | 30 | 16,269 | 4,881 |
| Carrots | 100 | 7,200 | 7,200 |
| Celery | 100 | 18,897 | 18,897 |
| Cherries (Sweet + Tart) | 90 | 134,138 | 120,724 |
| Cucumbers (Fresh + Pickled) | 90 | 51,140 | 46,026 |
| beans (green, snap) | 10 | 187,770 | 18,777 |
| Onions | 100 | 10,053 | 10,053 |
| plums+prunes | 70 | 439 | 307 |
| Peach | 60 | 5,906 | 3,544 |
| Pears | 50 | 1,235 | 618 |
| Peppers | 80 | 14,896 | 11,917 |
| Pumpkin | 90 | 12,080 | 10,872 |
| Soybean | 10 | 851,228 | 85,123 |
| Squash | 90 | 19,543 | 17,589 |
| Strawberry | 40 | 4,735 | 1,894 |
| Tomatoes | 80 | 52,928 | 42,342 |
| Total | 2,042,601 | 1,008,606 |
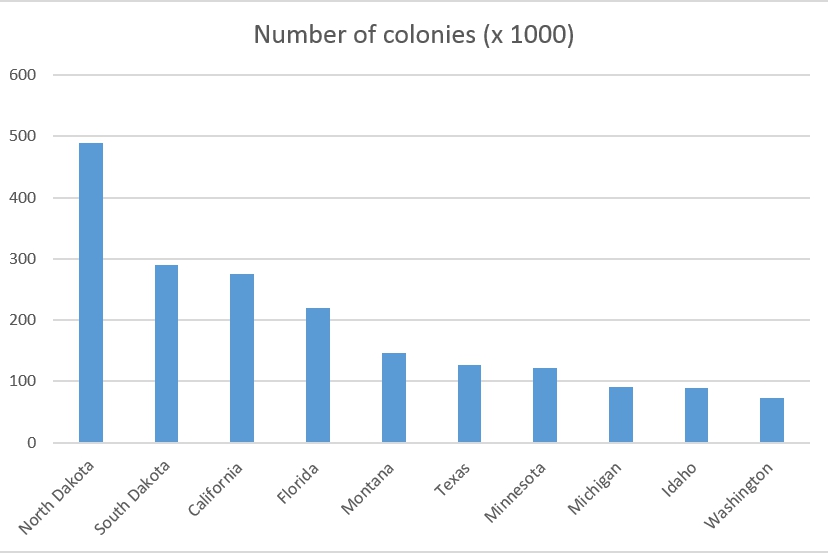
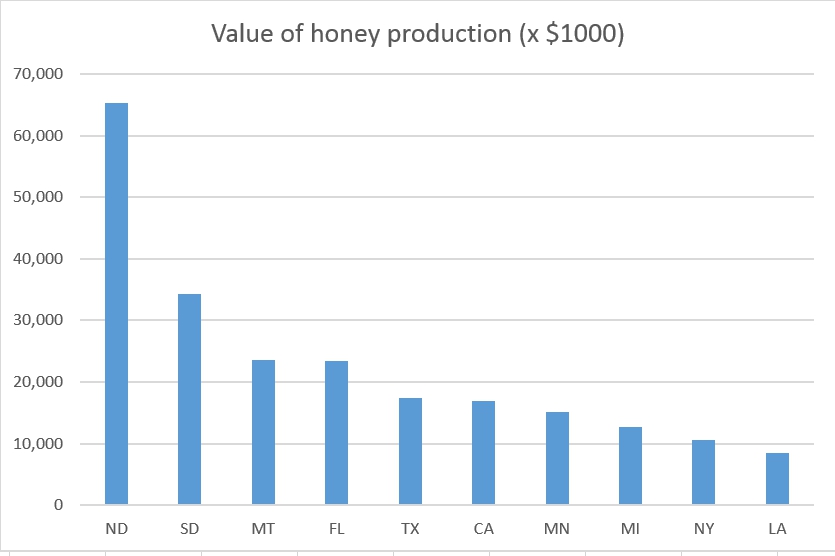
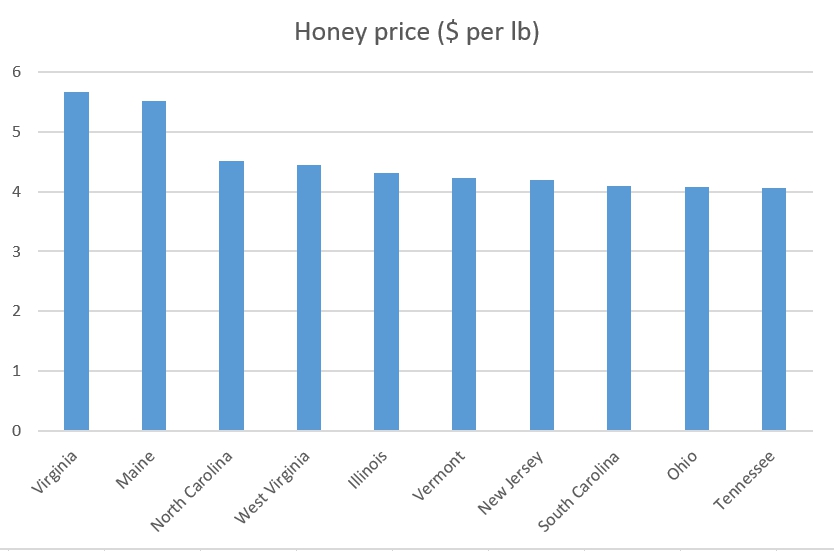
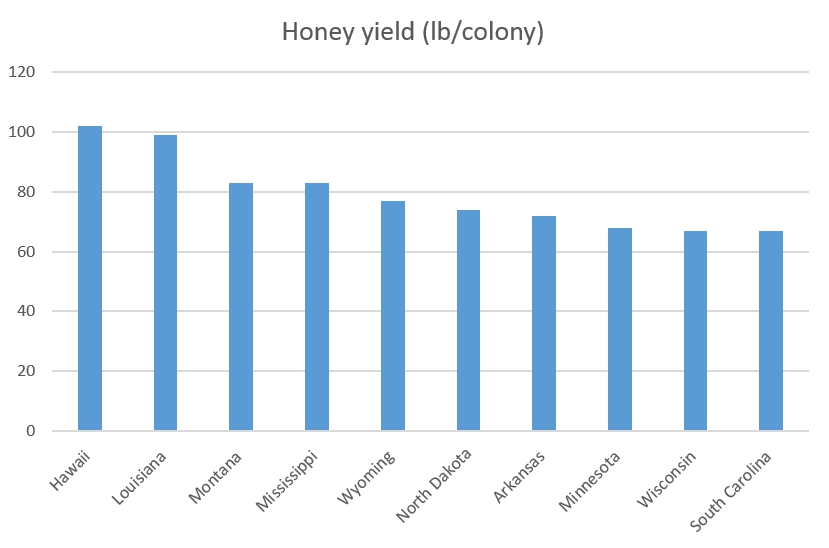
2. Top 10 statistics related to honey and bees in the country.
1. Number of colonies was 90,000 for Michigan in 2015, ranked 8th in the country.

2. Value of honey production was $12,685,000 in 2015, down from $14,275,000 in 2014, but still 8th in the country.

3. Michigan honey price was not in this chart. It ranked 20th at $2.43 per lb in 2015. I am guessing that this is an average of both whole sale and retail prices. Or it could be just the whole sale price? Retail is typical $5-10 per lb during the last 2-3 years. NASS does not say clearly.

4. Michigan again does not show on the radar for honey yield. It ranked 15th in the country, with a yield of 58 lbs per colony in 2015.

References
Michigan crop value for 2015: https://www.nass.usda.gov/Quick_Stats/Ag_Overview/stateOverview.php?state=MICHIGAN
Honey production stats for 2015: http://usda.mannlib.cornell.edu/usda/current/Hone/Hone-03-22-2016.txt
Gordon, J., L. Davis. 2003. Valuing honeybee pollination, A report for the Rural Industries Research and Development Corporation. RIRDC Publication No 03/077, RIRDC Project No CIE-15A
Huang, Z.Y. 2010. Bees worth a billion $ in Michigan. http://bees.msu.edu/bees-worth-a-billion-in-michigan/

It is not clear, for me, if the percentages on column 2 are related to crop production or seeds production. On the header says ” Some crops do not need honey bees for production (e.g. cabbage, carrots, celery, and onions)” but % dependency column shows 100.
Really great data! I am currently in an ISB208 class and our final project is focused on the declining bee populations in the United States – Michigan and how this is related to . I would love to speak more about the bee population and how they effect the food industry.
Those numbers are for seed production.